Code
%load_ext jupyter_black
%load_ext autoreload
%autoreload 2Load IBTrACS (Knapp et al. (2010)) from Postgres, and plot just to check the right stuff has been loaded.
%load_ext jupyter_black
%load_ext autoreload
%autoreload 2from src.datasources import ibtracs, zma
import pandas as pd
import geopandas as gpd
from shapely.geometry import LineString
from matplotlib import pyplot as pltgdf_zma = zma.load_zma()total_bounds = gdf_zma.total_boundstotal_boundsarray([-86.8, 18.5, -72.3, 24. ])df_all = ibtracs.load_ibtracs_in_bounds(*total_bounds)df_all| point_id | sid | valid_time | latitude | longitude | wind_speed | gust_speed | pressure | max_wind_radius | last_closed_isobar_radius | last_closed_isobar_pressure | basin | nature | provider | quadrant_radius_34 | quadrant_radius_50 | quadrant_radius_64 | created_at | |
|---|---|---|---|---|---|---|---|---|---|---|---|---|---|---|---|---|---|---|
| 0 | fdc4f638-eb3d-4044-912c-a80e2921f92f | 2023152N26274 | 2023-06-03 18:00:00.000039 | 23.900000 | -85.000000 | 25.0 | NaN | 1001.0 | 40.0 | 140.0 | 1005.0 | NA | DS | nhc_working_bt | [nan, nan, nan, nan] | [nan, nan, nan, nan] | [nan, nan, nan, nan] | 2025-05-13 21:22:52.749544 |
| 1 | 8cd22c3c-b67f-4c58-947e-1375b54f0d46 | 2023152N26274 | 2023-06-03 21:00:00.000039 | 23.677523 | -84.609840 | 25.0 | NaN | 1001.0 | 40.0 | 140.0 | 1005.0 | NA | DS | None | [nan, nan, nan, nan] | [nan, nan, nan, nan] | [nan, nan, nan, nan] | 2025-05-13 21:22:52.749544 |
| 2 | 030c5694-3836-436d-a5ef-e5b83fa46a81 | 2023152N26274 | 2023-06-04 00:00:00.000039 | 23.500000 | -84.099998 | 25.0 | NaN | 1002.0 | 40.0 | 140.0 | 1005.0 | NA | DS | nhc_working_bt | [nan, nan, nan, nan] | [nan, nan, nan, nan] | [nan, nan, nan, nan] | 2025-05-13 21:22:52.749544 |
| 3 | ebb42dc3-fd00-4381-acd4-8f4f874ad1a6 | 2023152N26274 | 2023-06-04 03:00:00.000039 | 23.382824 | -83.555038 | 25.0 | NaN | 1002.0 | 35.0 | 140.0 | 1005.0 | NA | DS | None | [nan, nan, nan, nan] | [nan, nan, nan, nan] | [nan, nan, nan, nan] | 2025-05-13 21:22:52.749544 |
| 4 | 037fb1c8-0fb4-4455-ac15-3687be8880d1 | 2023152N26274 | 2023-06-04 06:00:00.000039 | 23.299999 | -83.000000 | 25.0 | NaN | 1002.0 | 30.0 | 140.0 | 1005.0 | NA | DS | nhc_working_bt | [nan, nan, nan, nan] | [nan, nan, nan, nan] | [nan, nan, nan, nan] | 2025-05-13 21:22:52.749544 |
| ... | ... | ... | ... | ... | ... | ... | ... | ... | ... | ... | ... | ... | ... | ... | ... | ... | ... | ... |
| 3058 | 4ff60e09-8b82-497c-bdf7-57fdaff92070 | 2022266N12294 | 2022-09-27 00:00:00.000039 | 20.799999 | -83.300003 | 85.0 | 105.0 | 965.0 | 20.0 | 130.0 | 1006.0 | NA | TS | hurdat_atl | [100.0, 90.0, 60.0, 90.0] | [50.0, 50.0, 20.0, 30.0] | [30.0, 25.0, nan, 20.0] | 2025-05-13 21:22:52.749544 |
| 3059 | 89a90801-a7f1-492e-8c69-75ea047d8a2a | 2022266N12294 | 2022-09-27 06:00:00.000039 | 21.799999 | -83.599998 | 100.0 | 120.0 | 956.0 | 15.0 | 200.0 | 1008.0 | NA | TS | hurdat_atl | [100.0, 100.0, 70.0, 90.0] | [50.0, 50.0, 30.0, 40.0] | [30.0, 25.0, 20.0, 20.0] | 2025-05-13 21:22:52.749544 |
| 3060 | 4bc322f1-1600-41a0-b8a9-18b2005d9843 | 2022266N12294 | 2022-09-27 08:30:00.000066 | 22.200001 | -83.699997 | 110.0 | NaN | 947.0 | 15.0 | 200.0 | 1008.0 | NA | TS | hurdat_atl | [100.0, 100.0, 70.0, 90.0] | [50.0, 50.0, 30.0, 40.0] | [30.0, 25.0, 20.0, 20.0] | 2025-05-13 21:22:52.749544 |
| 3061 | 44c6b365-52e7-4945-9669-4843f6b68c81 | 2022266N12294 | 2022-09-27 12:00:00.000039 | 22.600000 | -83.599998 | 100.0 | 135.0 | 963.0 | 15.0 | 270.0 | 1009.0 | NA | TS | hurdat_atl | [120.0, 120.0, 100.0, 120.0] | [60.0, 60.0, 50.0, 60.0] | [30.0, 25.0, 20.0, 20.0] | 2025-05-13 21:22:52.749544 |
| 3062 | f856ebc9-966b-4337-8efd-a60a998bcec3 | 2022266N12294 | 2022-09-27 18:00:00.000039 | 23.500000 | -83.300003 | 105.0 | 130.0 | 951.0 | 15.0 | 270.0 | 1009.0 | NA | TS | hurdat_atl | [120.0, 120.0, 100.0, 120.0] | [60.0, 60.0, 50.0, 60.0] | [35.0, 35.0, 20.0, 20.0] | 2025-05-13 21:22:52.749544 |
3063 rows × 18 columns
df_all.dtypespoint_id object
sid object
valid_time datetime64[ns]
latitude float64
longitude float64
wind_speed float64
gust_speed float64
pressure float64
max_wind_radius float64
last_closed_isobar_radius float64
last_closed_isobar_pressure float64
basin object
nature object
provider object
quadrant_radius_34 object
quadrant_radius_50 object
quadrant_radius_64 object
created_at datetime64[ns]
dtype: objectdef df_to_track_lines(df: pd.DataFrame) -> gpd.GeoDataFrame:
"""
Convert a DataFrame of points to a GeoDataFrame of LineStrings,
grouped by 'sid'.
Parameters:
df: DataFrame with 'sid', 'latitude', 'longitude' columns
Returns:
GeoDataFrame with one LineString per 'sid'
"""
# Ensure sorted order if needed (e.g., by time)
df = df.sort_values(["sid"]) # optionally add 'time' or similar
# Group and build LineStrings
lines = (
df.groupby("sid")
.filter(lambda group: len(group) > 1) # Keep only groups with more than one point
.groupby("sid")
.apply(
lambda group: LineString(
zip(group["longitude"], group["latitude"])
)
)
.reset_index(name="geometry")
)
return gpd.GeoDataFrame(lines, geometry="geometry", crs="EPSG:4326")gdf_lines = df_to_track_lines(df_all)/var/folders/61/cp06zhcj4y76q7rfx0qlm06c0000gn/T/ipykernel_9023/1121599445.py:21: DeprecationWarning: DataFrameGroupBy.apply operated on the grouping columns. This behavior is deprecated, and in a future version of pandas the grouping columns will be excluded from the operation. Either pass `include_groups=False` to exclude the groupings or explicitly select the grouping columns after groupby to silence this warning.
.apply(gdf_lines| sid | geometry | |
|---|---|---|
| 0 | 1851228N13313 | LINESTRING (-79 21.2, -72.6 18.9, -74.3 19.4, ... |
| 1 | 1852232N21293 | LINESTRING (-74 21.9, -74.9 22.1, -76.1 22.2, ... |
| 2 | 1852264N13309 | LINESTRING (-73 21.4, -73.6 21.9, -74 22.5, -7... |
| 3 | 1852278N14293 | LINESTRING (-83.1 18.7, -86.4 21.2, -85.5 20.4... |
| 4 | 1855236N12304 | LINESTRING (-72.3 19.5, -73.6 19.7) |
| ... | ... | ... |
| 410 | 2022154N21273 | LINESTRING (-86.3 22.8, -85.1 23.9) |
| 411 | 2022266N12294 | LINESTRING (-82.4 18.7, -83 19.7, -83.3 20.8, ... |
| 412 | 2023152N26274 | LINESTRING (-85 23.9, -84.60984 23.67752, -84.... |
| 413 | 2023239N21274 | LINESTRING (-86.1 20.8, -86.14497 21.11002, -8... |
| 414 | 2023321N15278 | LINESTRING (-77.84354 18.57282, -77.2 19.2) |
415 rows × 2 columns
fig, ax = plt.subplots()
max_lines = 100
plotted_lines = 0
for sid, row in gdf_lines.iterrows():
    plotted_lines += 1
    if plotted_lines > max_lines:
        break
    x, y = row.geometry.xy
    ax.plot(x, y, label=str(row["sid"]))  # matplotlib auto-assigns color

gdf_zma.boundary.plot(ax=ax, color="k")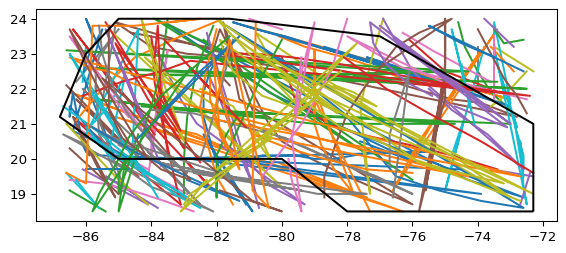
Looks like all the tracks are inside the ZMA, so should be good